🧱 Density Map
The density map displays large limit orders found in exchange order books.
It helps you quickly identify liquidity levels and potential support or resistance zones.
The map opens on the right side when you click the corresponding button in the right toolbar of the interface.
⚙️ How the Density Map Works
The map is presented as a vertical price scale.
Large limit orders from all supported exchanges are displayed on it.
The current market price is shown inside the cards.
- densities above the current price represent supply zones
- densities below the current price represent demand zones
The closer a density is to the current price, the more likely it is to interact with the market.
The screener uses data analysis algorithms and elements of artificial intelligence (AI) to process exchange order book information.
This helps detect significant liquidity levels more quickly and highlight orders that may influence price movement.
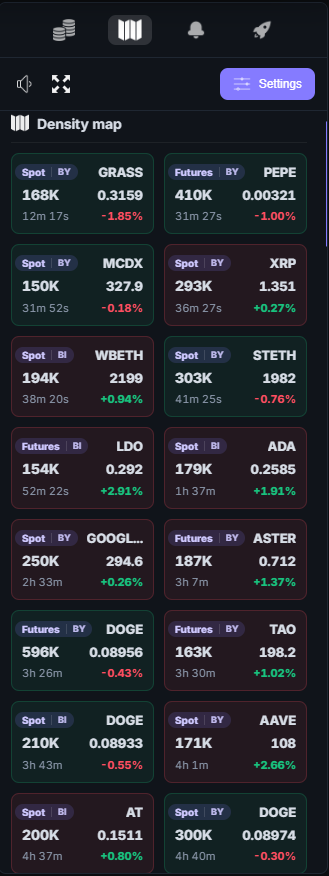
📊 Density Information
Each density is displayed as a block with brief information.
A density card includes:
- the exchange where the order was found
- the coin ticker
- the size of the limit order
- the order placement price
Example:
BY-F BTC 49M
This means:
- exchange: Bybit Futures
- coin: BTC
- order size: 49M USDT
🧩 Types of Densities
The screener automatically classifies detected densities by size.
Analysis algorithms help identify the most significant orders among large volumes of order book data.
📍 Density Position Relative to Price
The position of a density on the map shows its location relative to the current price.
- densities above the price can act as resistance
- densities below the price can act as support
This helps quickly identify potential zones where price movement may slow down or react.
🎯 Round Levels
Some densities may appear at so-called round levels.
These are prices ending in:
- 00
- 50
- 100
Round levels often attract large limit orders and may serve as important psychological levels in the market.
⚙️ Density Map Settings
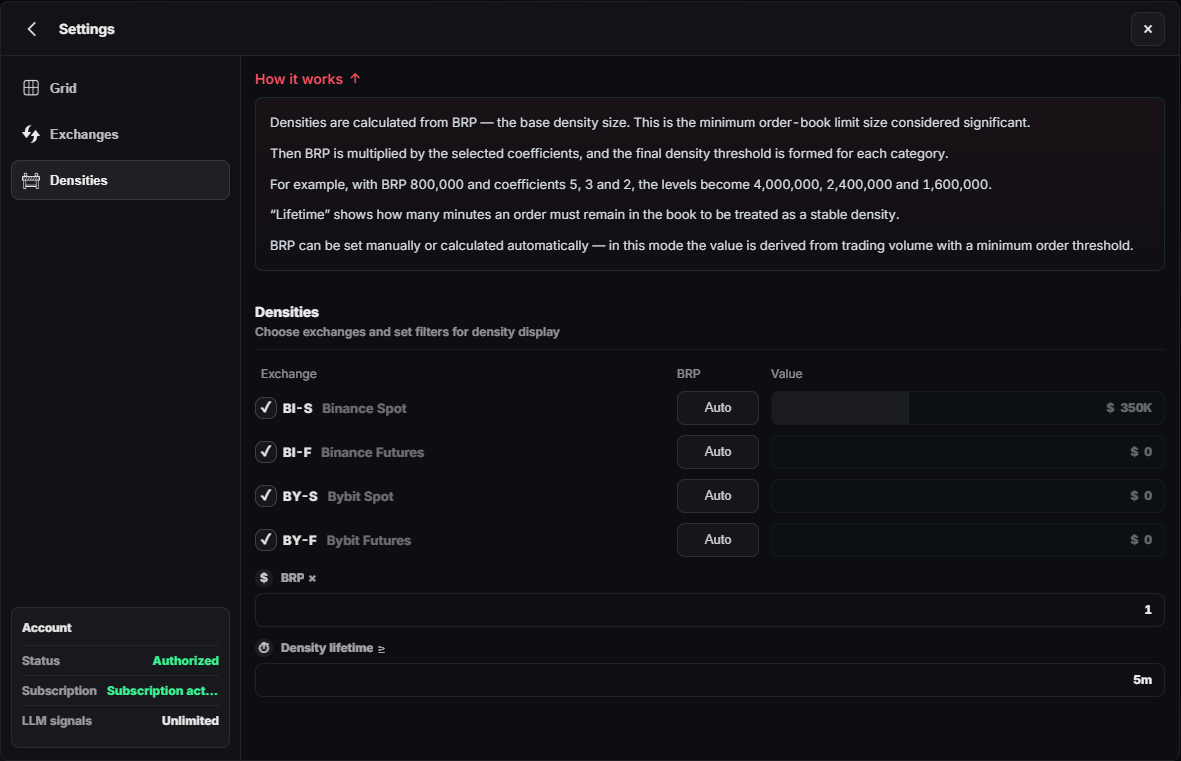
In the screener settings, you can adjust the depth of order book analysis.
Available range:
from 1% to 10% of the current price
This parameter determines how far from the current price the system will search for densities.
The larger the value:
- the more densities will be displayed
- the deeper the order book analysis becomes
Lower values help focus only on densities located closer to the current price.
📈 Using the Density Map
The density map is used for:
- finding liquidity zones
- identifying potential support and resistance levels
- analyzing the behavior of large market participants
The system also uses LLM models (large language models) to analyze market data and identify potentially interesting trading situations based on:
- liquidity behavior
- price movement
- appearance of large densities
- changes in market volatility
The density map allows you to quickly see key market levels without manually analyzing the order book of every coin.