📊 Chart
The chart displays the price movement of the selected coin and provides tools for technical analysis.
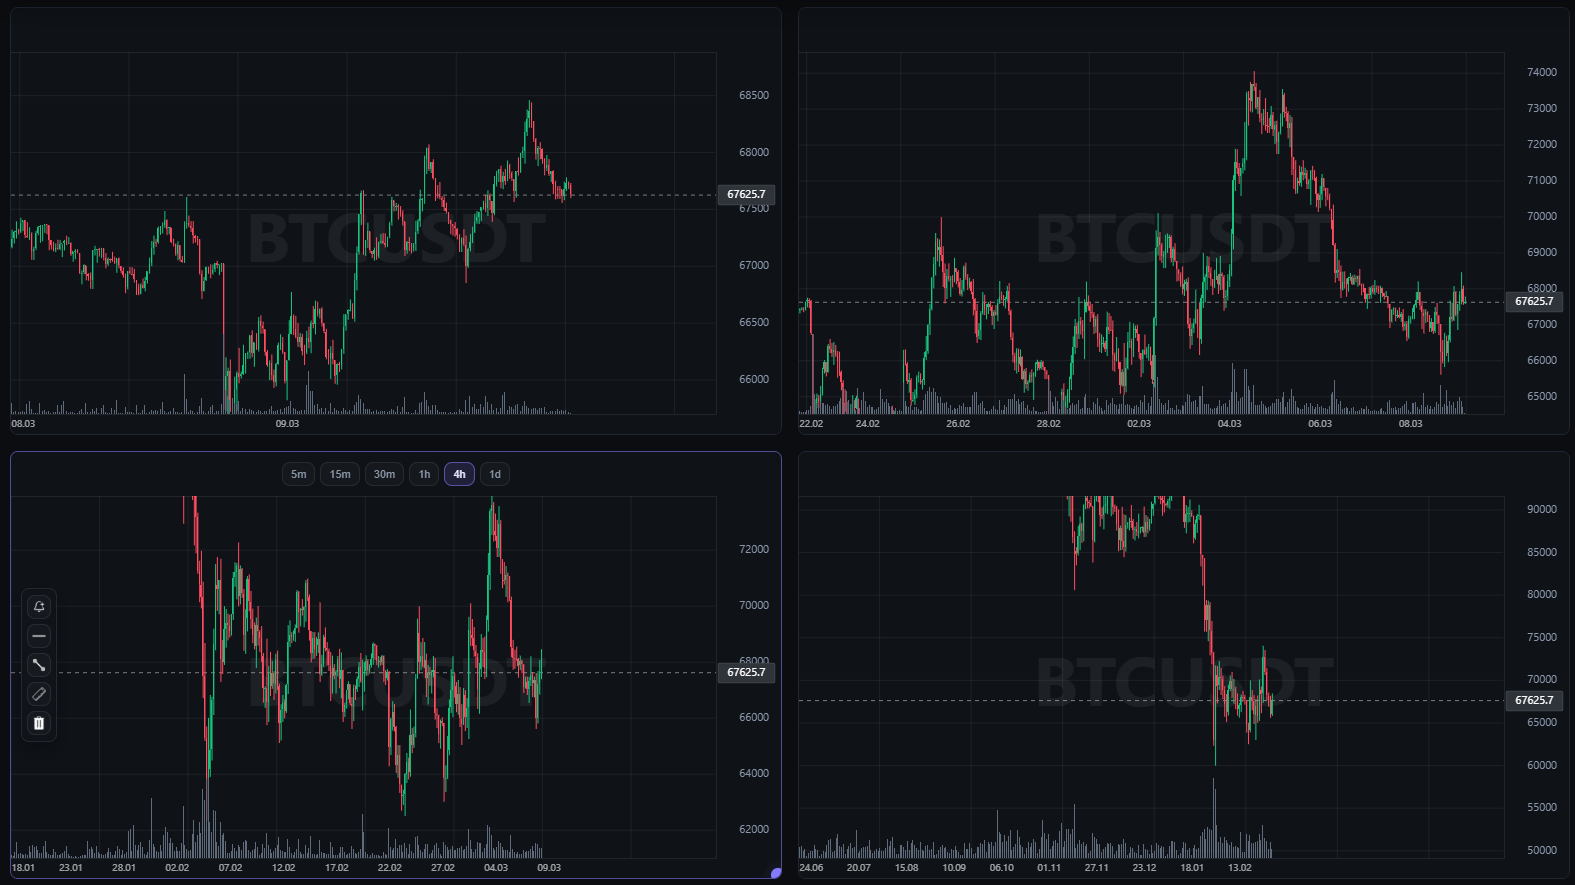
Each chart works independently and can display its own coin and timeframe.
The chart is the main working area for analyzing price, density levels, and market structure.
✏️ Drawing Tools
The chart includes tools for markup and analysis.
🧰 Available tools
📈 Trend Line
Allows you to draw sloping lines and mark the direction of price movement.
Used for trend analysis and channel construction.
📏 Horizontal Level
Used to mark support and resistance levels.
Horizontal levels help identify key price zones.
🧱 Rectangle
Allows you to highlight price areas.
Most commonly used to mark consolidation zones or areas of interest.
📐 Ruler
A tool for measuring the distance between two points on the chart.
It helps determine:
- price change
- percentage movement
- time interval
Drawing tools allow you to quickly mark up the chart and fix important levels without switching to third-party services.
📊 Indicators Above the Chart
Technical indicators are displayed above each chart.
They allow you to quickly assess market conditions without opening additional panels.
⚙️ Depending on settings, the following may be shown
- 24h price change
- average volatility
- 24h trading volume
- correlation with BTC
The list of visible indicators can be configured in Settings.
The order of indicators can also be changed by rearranging them in the settings list.
🧱 Densities on the Chart
The screener displays large limit orders found in exchange order books.
These orders are called densities.
On the chart, they are shown as horizontal lines with an information label.
📋 The label includes
- the exchange where the order was found
- the order volume in USDT
- the limit order price
Example:
BY-F 46M 26696
This means:
- exchange: Bybit Futures
- order size: 46M USDT
- price: 26696
Densities help identify areas of increased liquidity and zones where large market participants may be active.
⏱ Determining the Time a Density Appeared
Using the Ruler tool, you can determine when the order appeared in the book.
To do this, place the starting point of the ruler at the beginning of the density line.
This helps estimate:
- when the order appeared
- how long it has remained in the book
This parameter is commonly referred to as the order lifetime.
Density lifetime helps determine how long a large order has remained in the book and whether it is still relevant for analysis.
🌐 Multi-Exchange Chart Loading
Charts are loaded from multiple exchanges.
This makes it possible to see a more complete price history.