LLM signals as an analysis layer
Signals can highlight an active trading pair and provide a fast path into its analysis inside Screener.

Use LLM signals as an additional analysis layer and move quickly from a signal to checking price, chart structure, volume, levels and liquidity densities for the selected coin. A signal can highlight market movement, but it does not replace analysis.
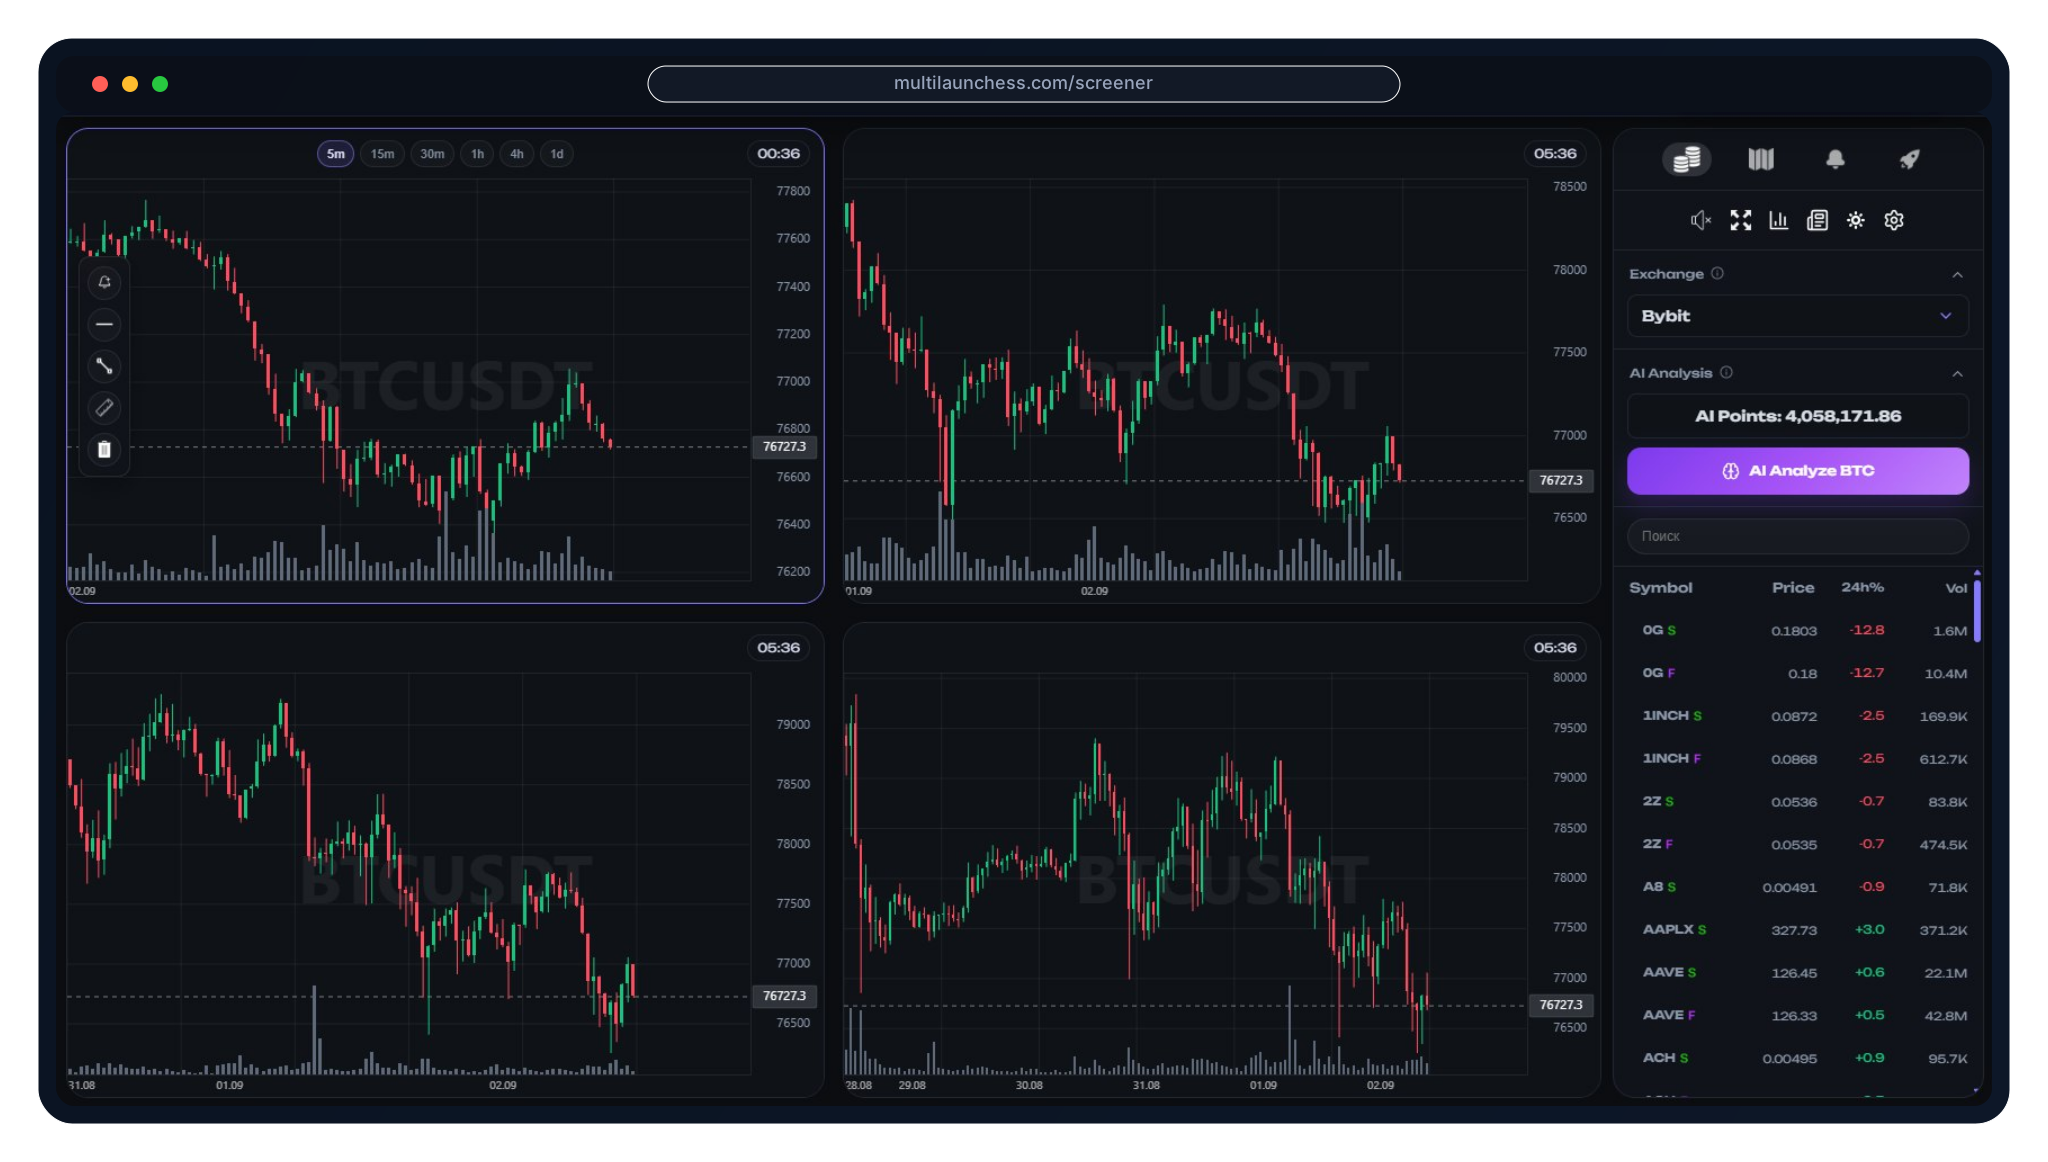
Signals can highlight an active trading pair and provide a fast path into its analysis inside Screener.
Every signal needs verification. Market conditions can change, so a decision should not rely on the signal alone.

Use a signal as a navigation point to the chart and other data for the instrument, not as an isolated message.

Compare the signal with the current price direction and chart structure on the selected timeframe.

Check whether price is close to important support, resistance or another relevant market area.

Price movement has different meaning in high and low activity regimes, so volume and volatility should be reviewed together.

The liquidity map helps reveal large visible limit orders and adds order-book context to the selected pair.

Key horizontal levels help identify where price interacts with areas that previously mattered to the market.

Combining chart structure, volume, levels and liquidity reduces reliance on a single information source.

Price alerts let you define an interesting price in advance and receive a notification when the market reaches it.

Trading notifications help follow market events without continuously watching the chart.

A signal highlights an analytical event, while a price alert is triggered by a predefined price condition. They should not be treated as the same thing.

Move to the relevant trading pair in Screener and review the current market state.

Compare price with levels, volume, volatility and available liquidity data.

Define the conditions under which the idea remains valid and what would invalidate it.
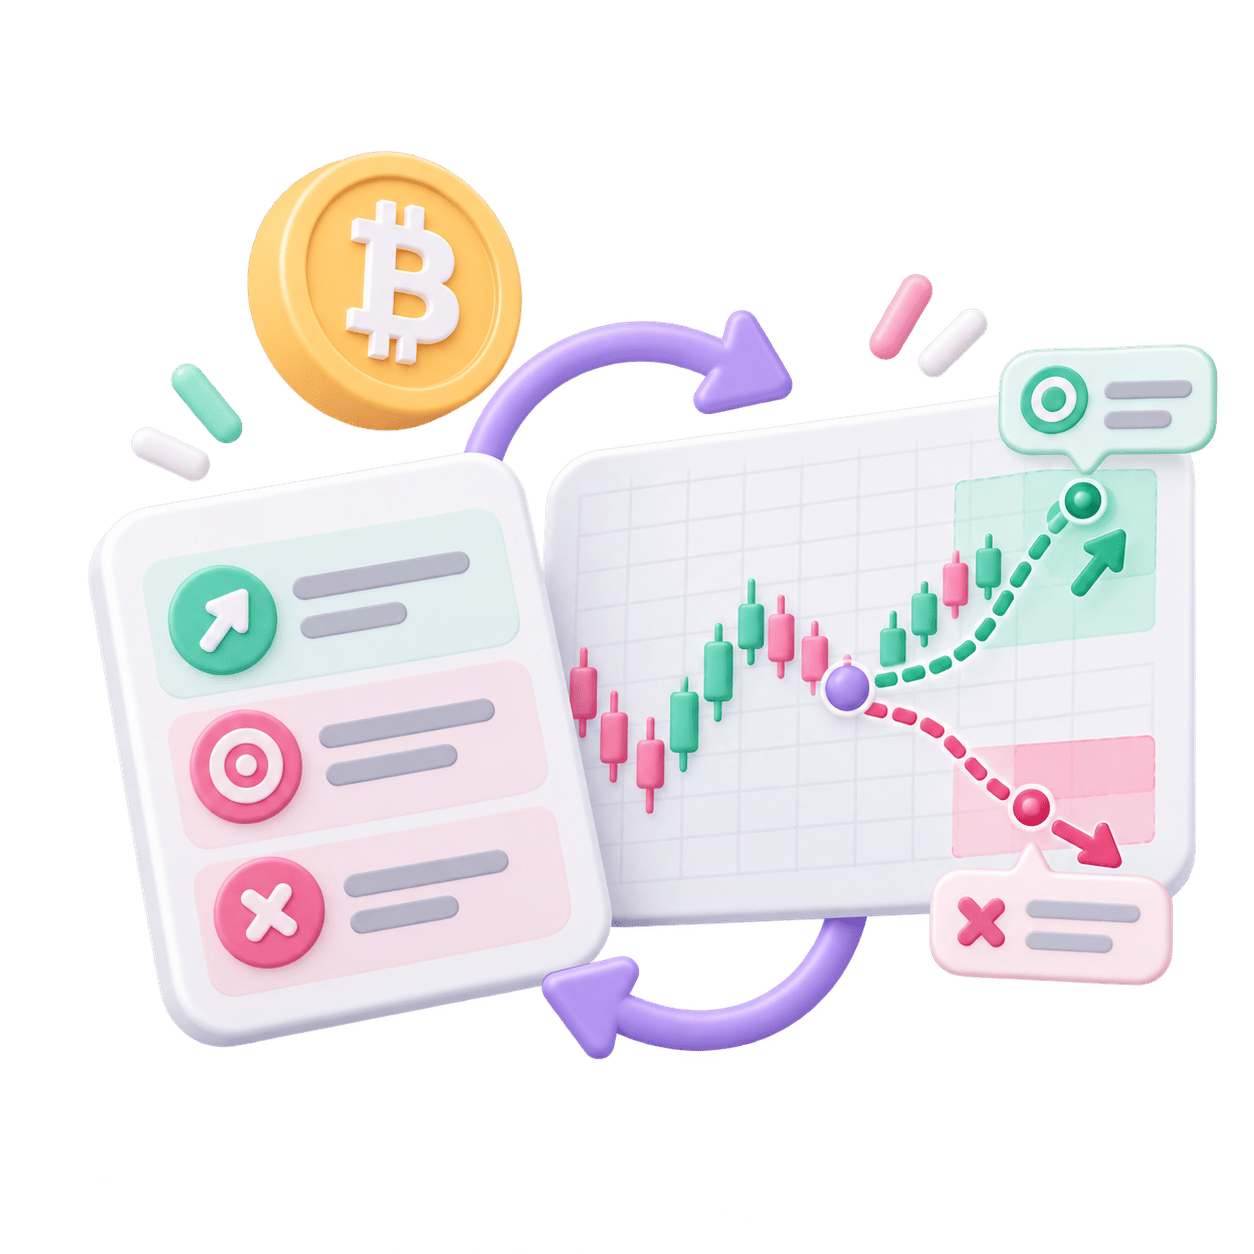
A signal does not replace risk management and cannot guarantee a profitable outcome.

They are analytical events or messages that draw attention to a market move or trading pair and lead into further analysis.
Buy and sell signals describe the direction of a trading idea. In futures terminology they are often associated with Long and Short scenarios, but the signal still needs to be checked against current market data and risk before a trading decision.
Screener uses LLM signals as an additional analysis layer. The signal should still be verified against current market data.
A signal cannot guarantee an outcome and does not replace chart analysis, levels, volume, volatility, liquidity or risk management.
A price alert triggers at a predefined price, while a signal relates to an analytical event. They are different mechanisms.
The current Screener product surface includes Telegram notifications and trading alerts as part of market monitoring.
Yes. You can move to the relevant trading pair and compare the move with chart structure, volume, levels and liquidity densities.
Open Screener and move from a signal to analysis of the selected coin: chart structure, volume, levels, liquidity densities and other available data in one workspace.