What is a support level
A support level is a price area where buyers previously produced a visible market reaction. It adds context but does not guarantee a reversal.

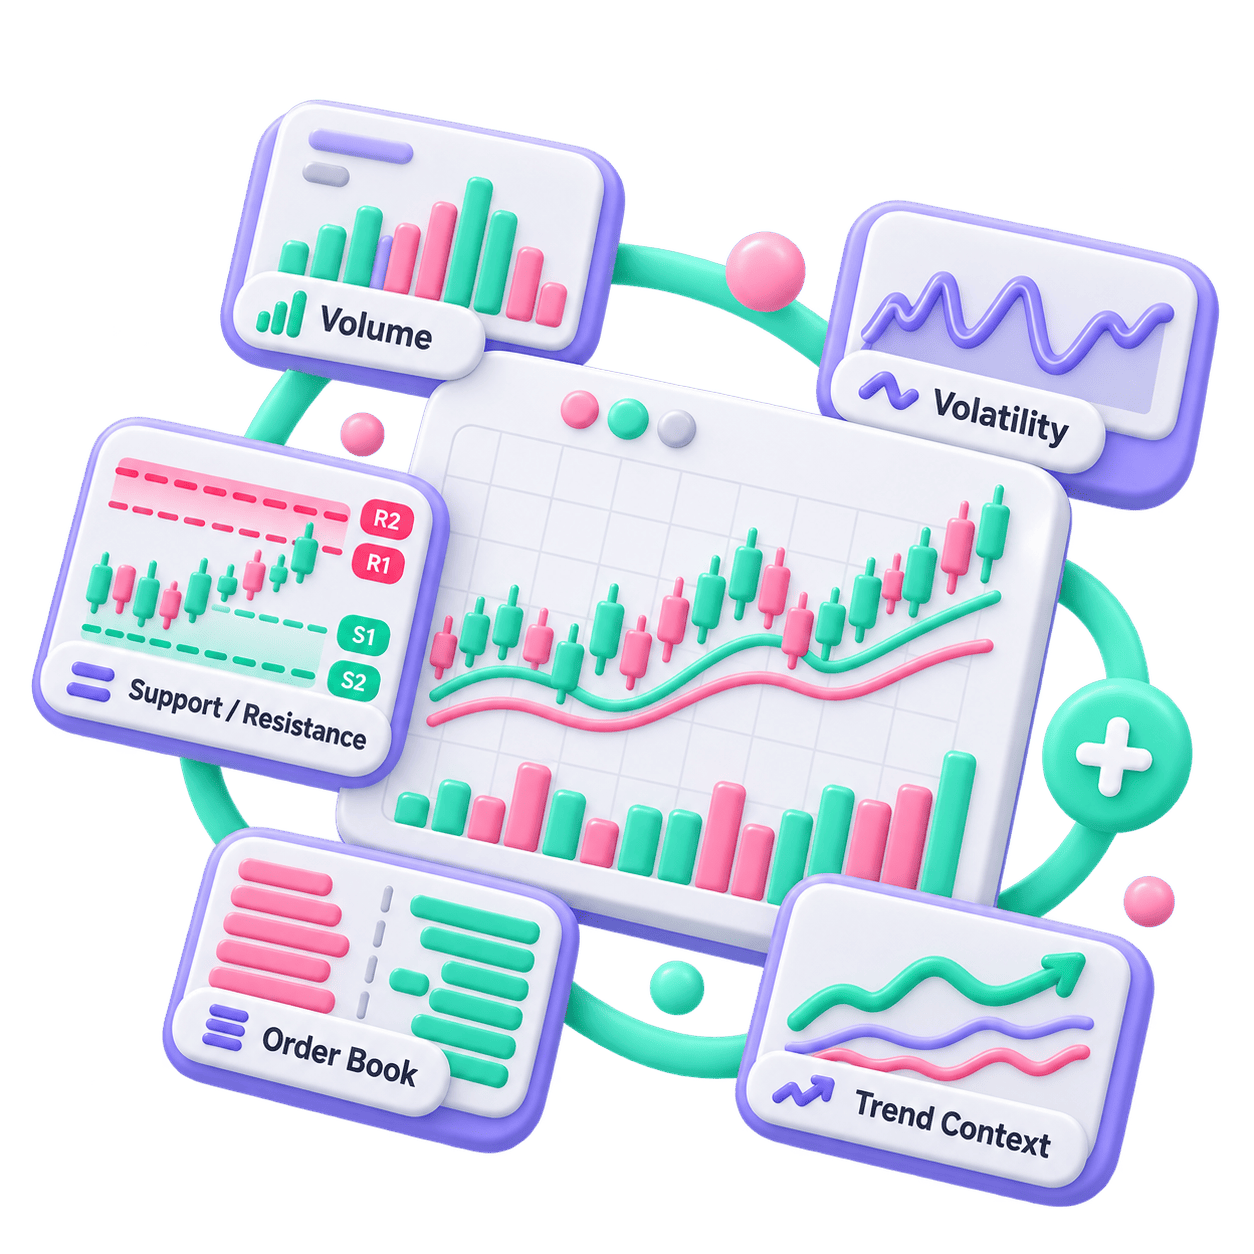
Find key horizontal levels and zones where the market previously reacted. Compare them with chart structure, volume, volatility, liquidity densities and other Screener data to evaluate a trading scenario in context.
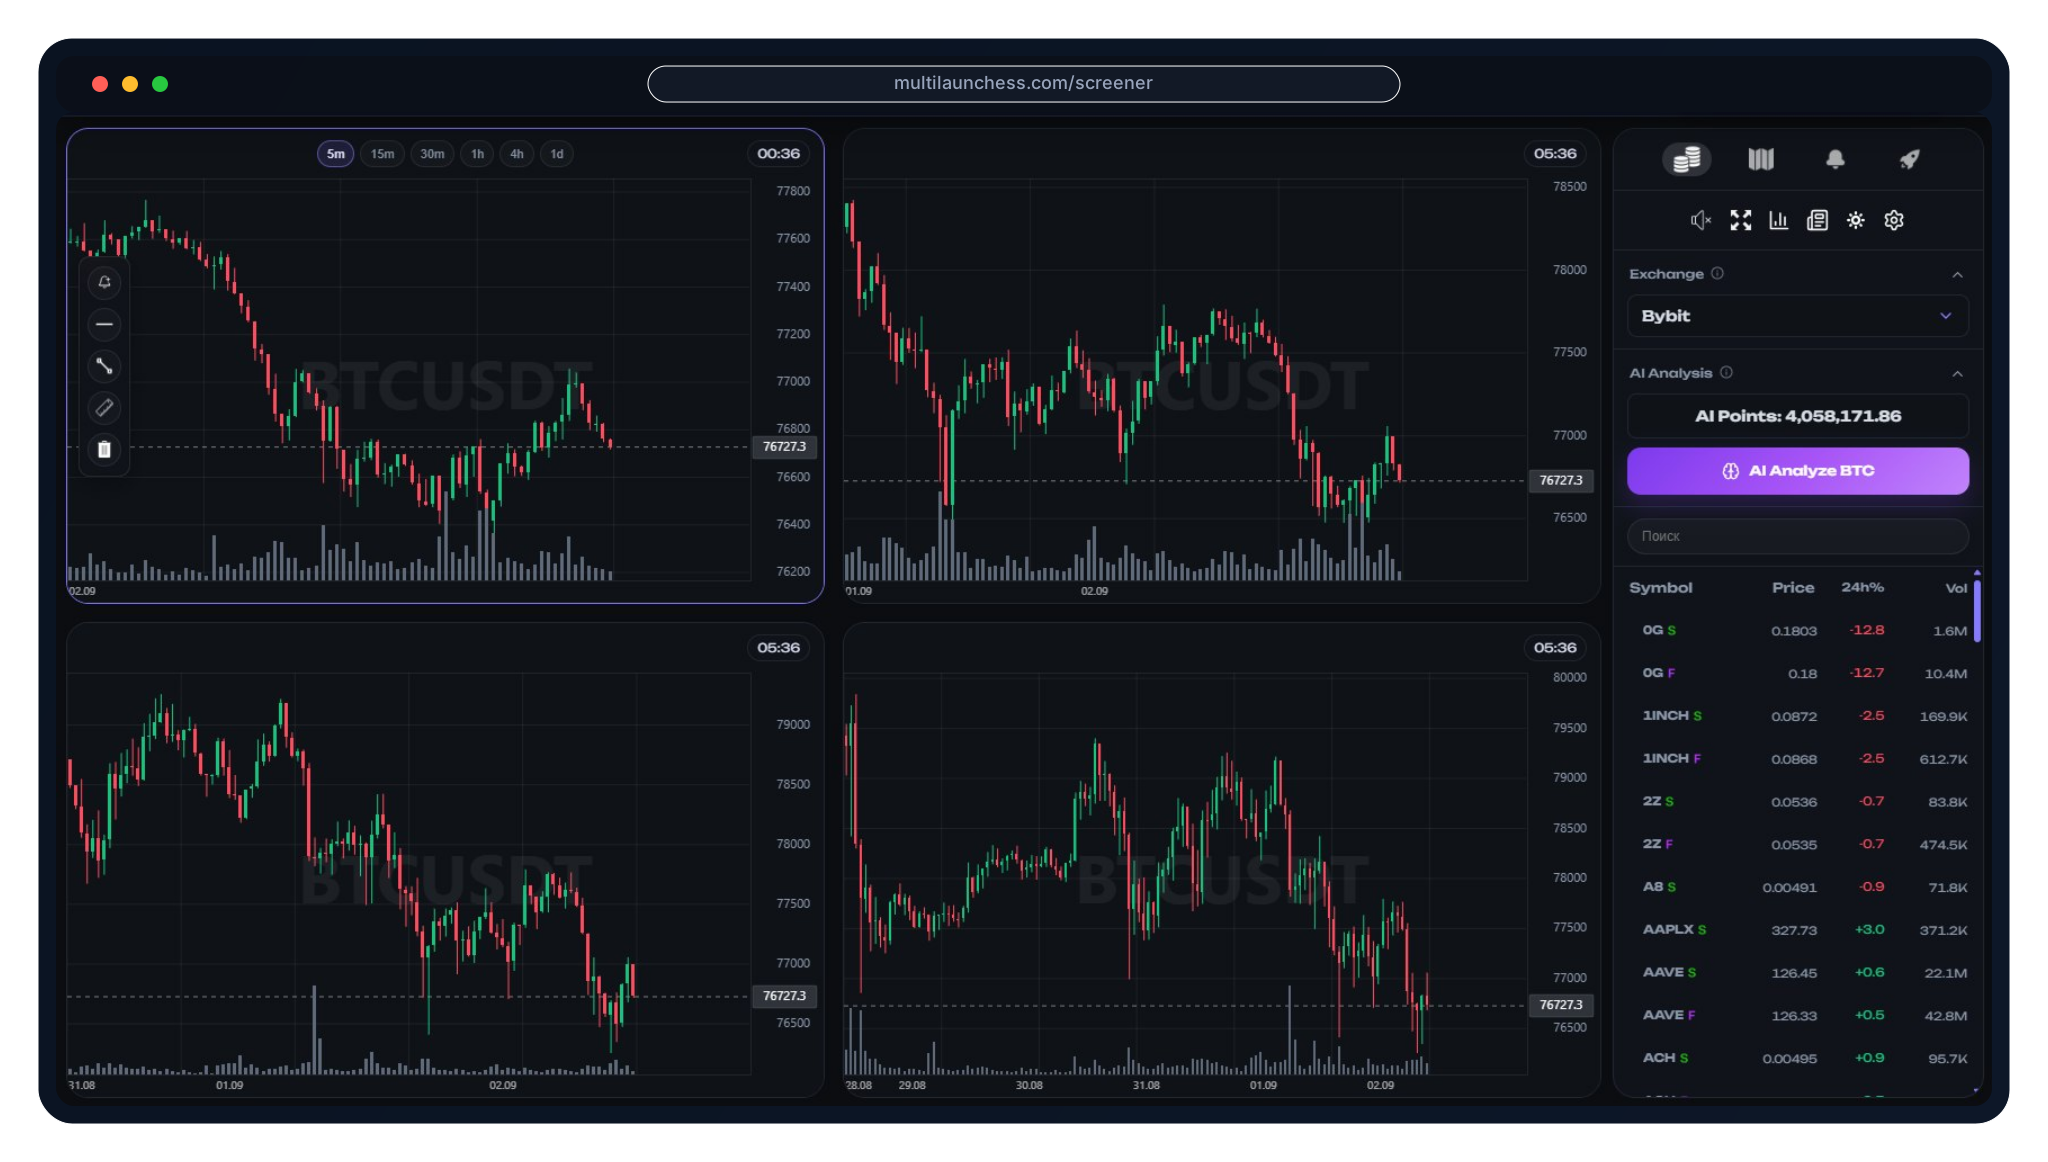
A support level is a price area where buyers previously produced a visible market reaction. It adds context but does not guarantee a reversal.
A resistance level is a price area where seller reaction previously increased. Screener lets you evaluate that area together with the current market structure.

Price can react near a marked area, move through it or ignore it. A level is therefore part of a scenario, not a standalone trading signal.
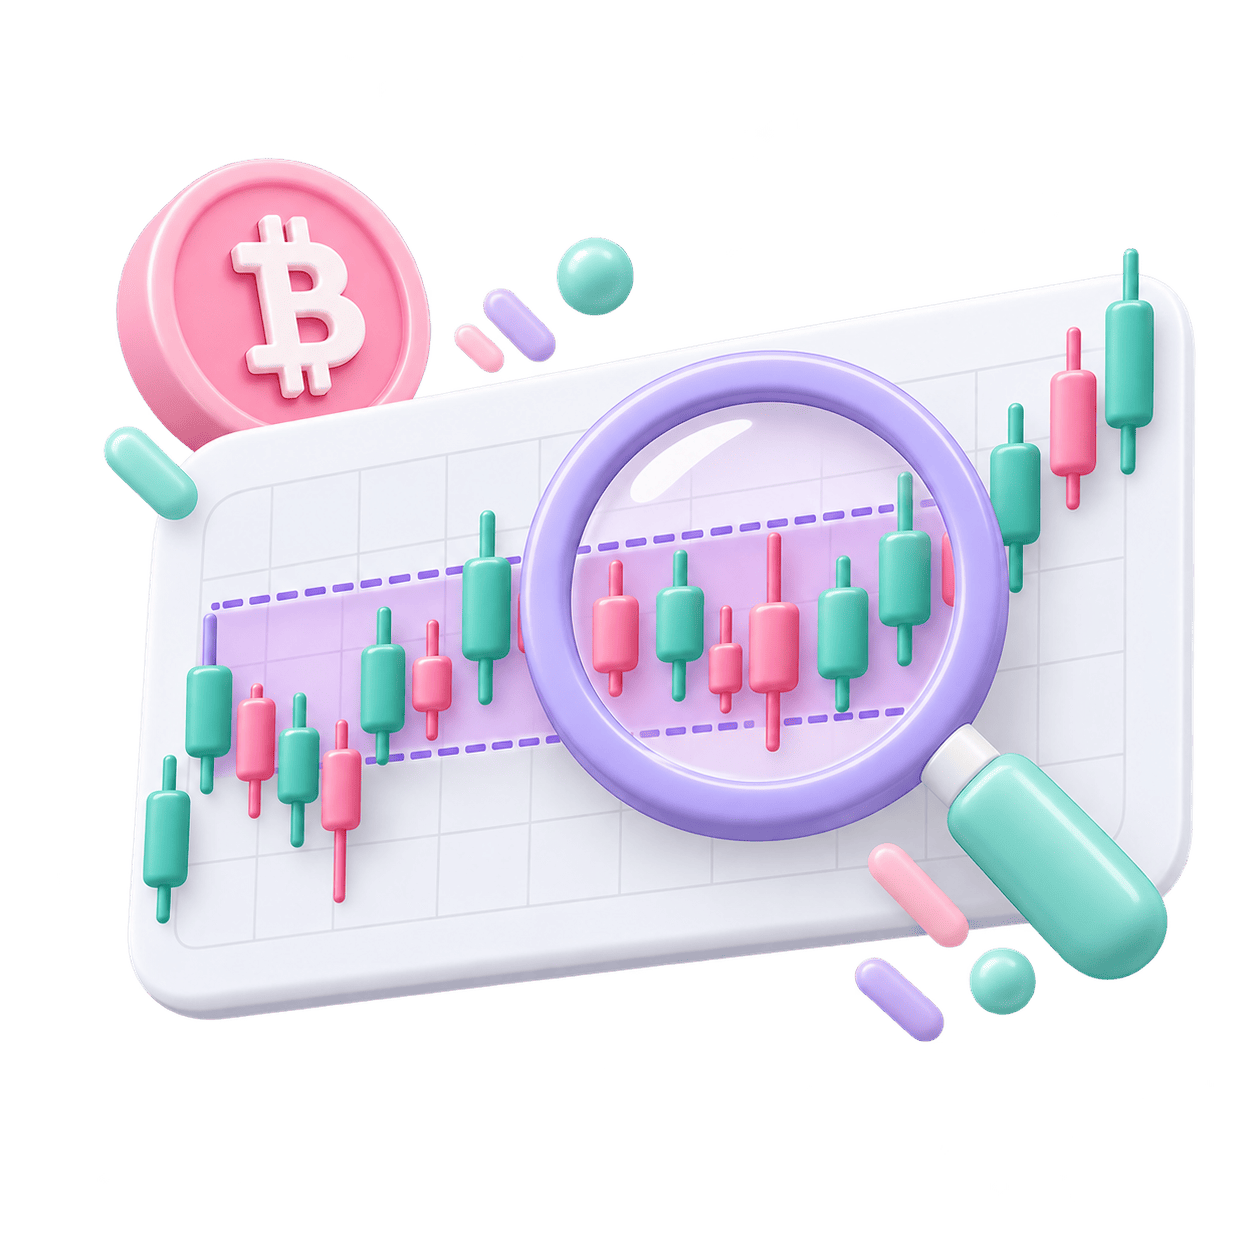
Screener highlights key horizontal levels and zones where the market previously reacted, reducing the need to mark every pair manually.

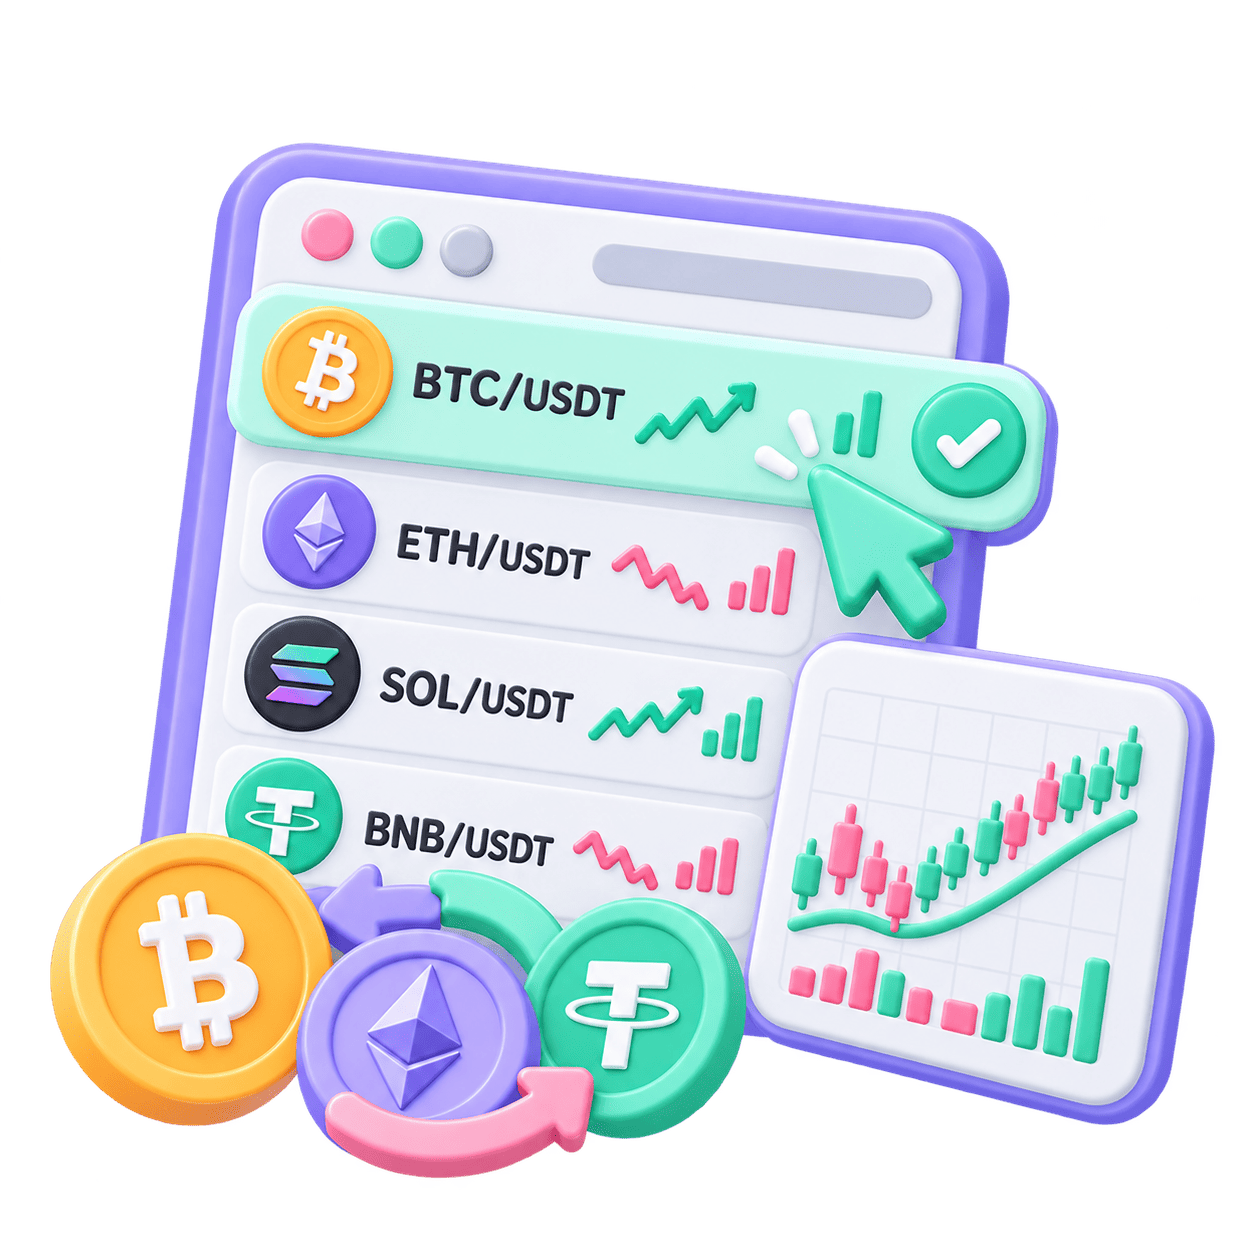
Open a selected trading pair and evaluate where a level sits relative to the current price and chart structure.
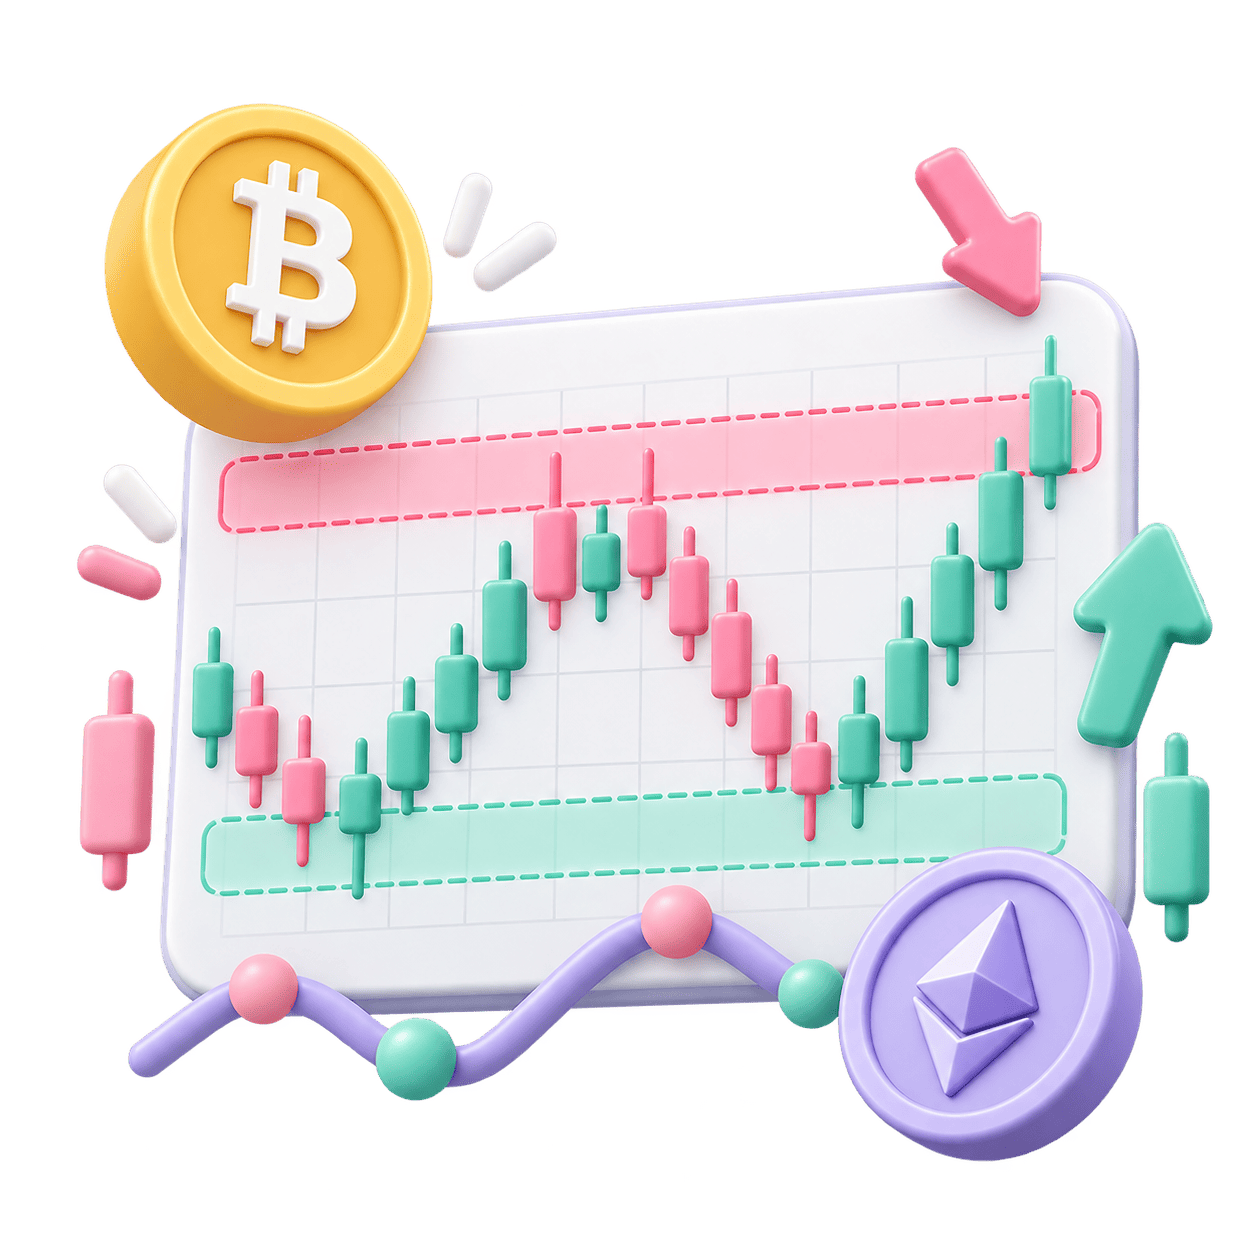
Review levels across supported Binance and Bybit Spot and Futures markets in one workspace.
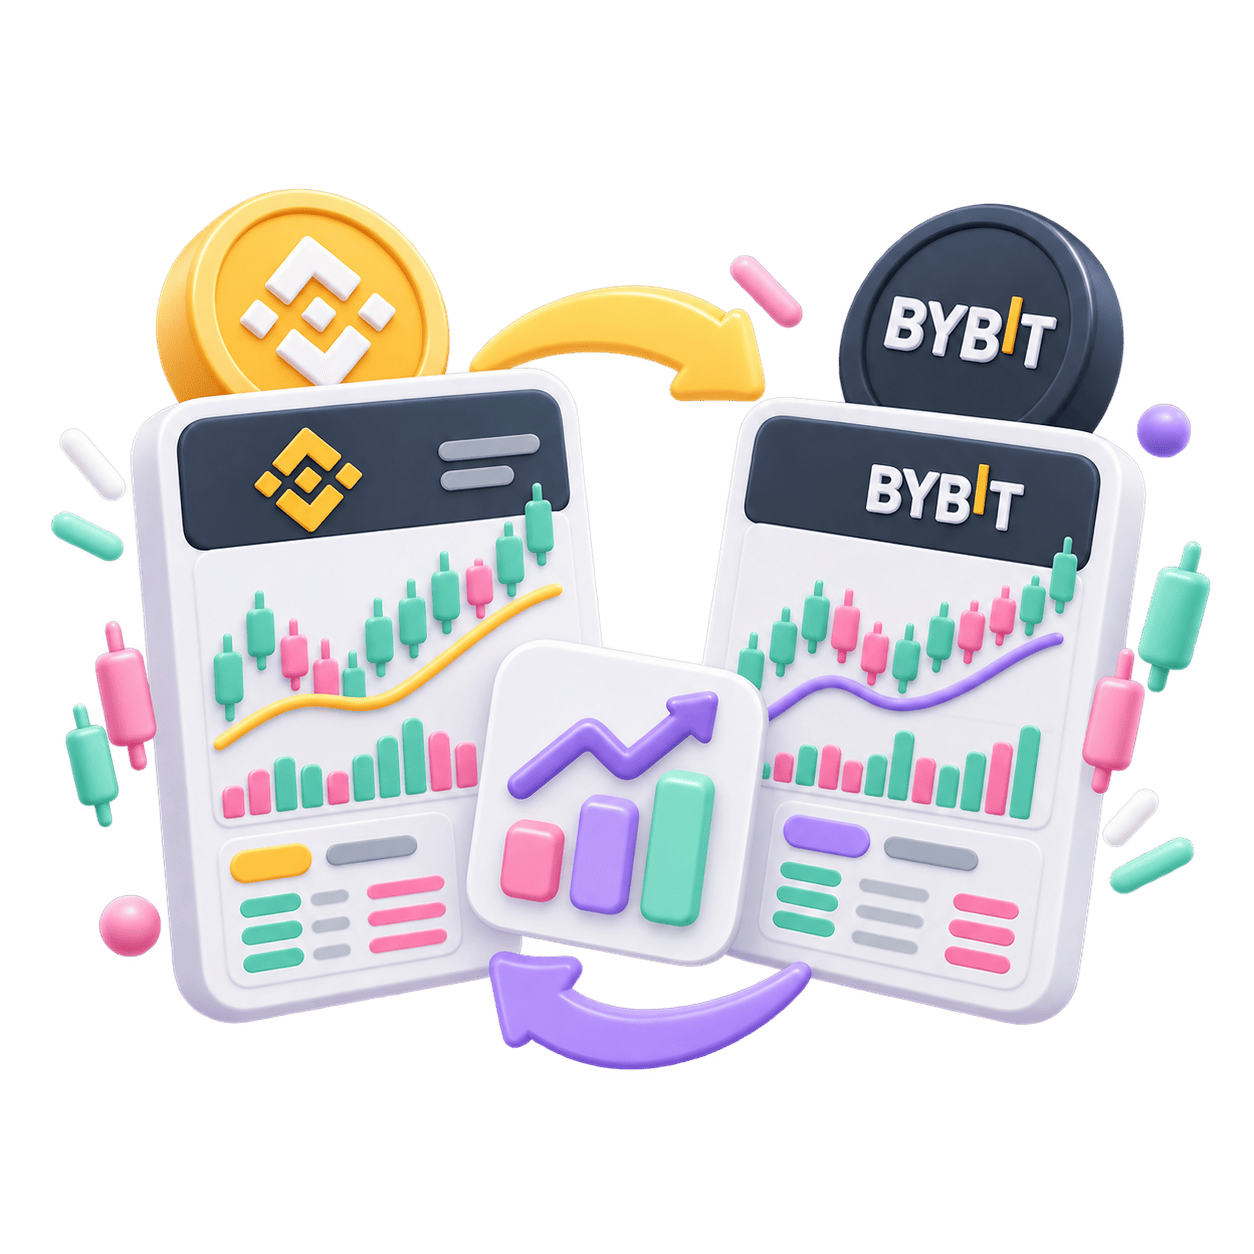
Watch how price approaches the area. Movement speed, activity and candle structure add context before the interaction.

After price moves through a level, check whether it holds beyond the area or returns. A breakout alone does not confirm continuation.

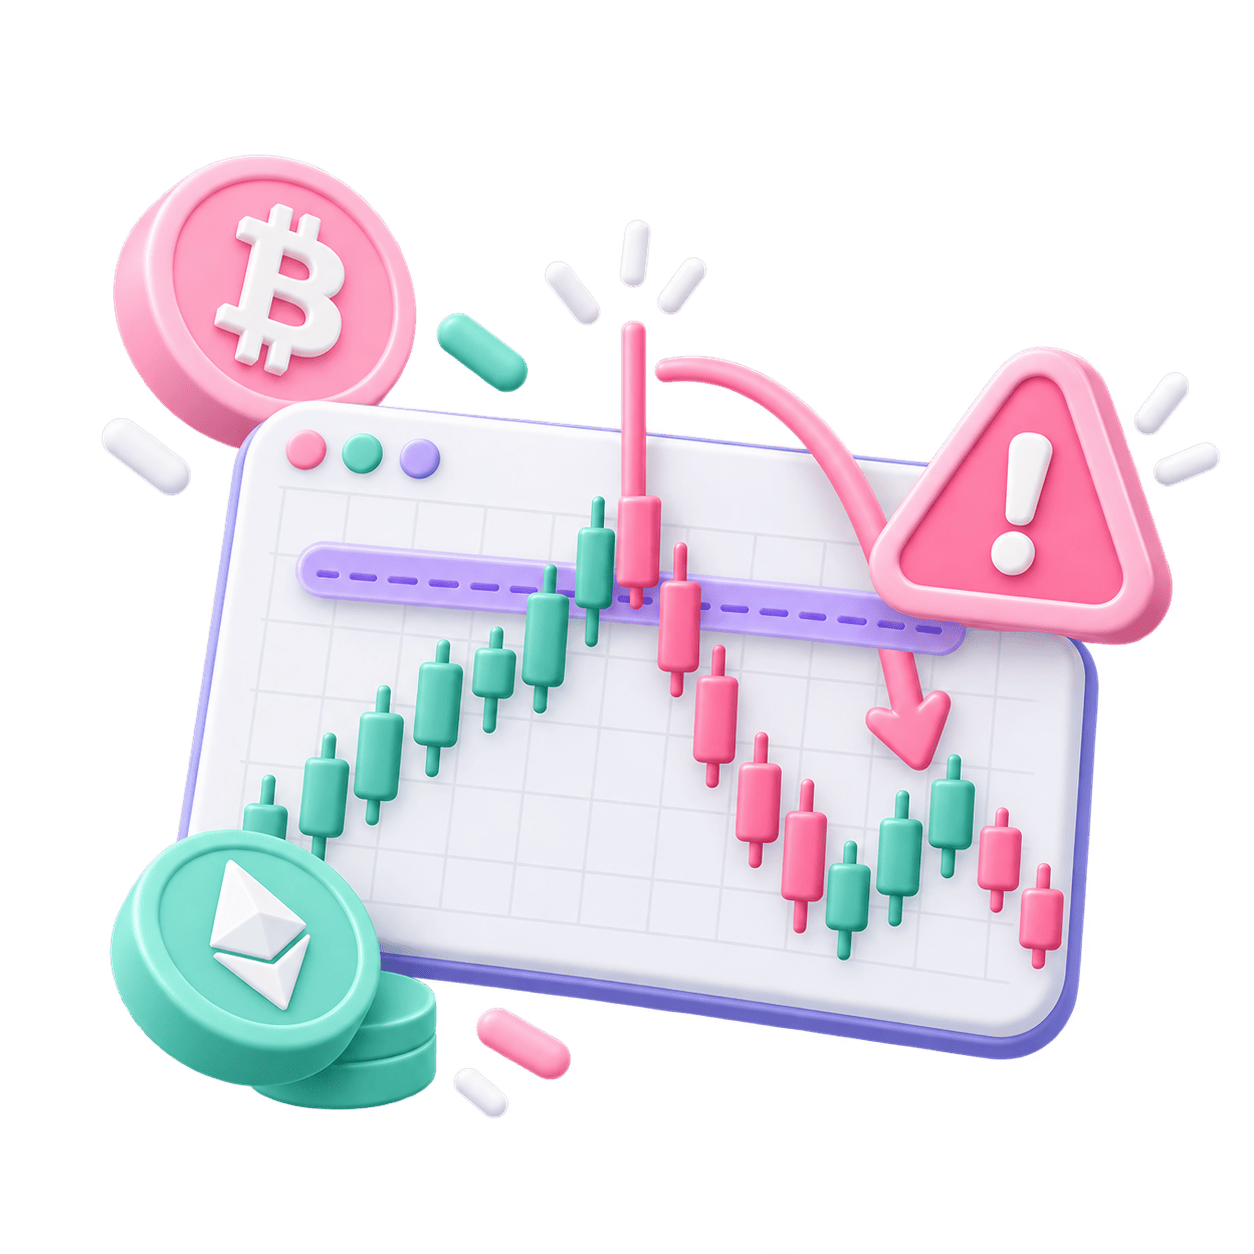
A brief move beyond a level followed by a return shows why a trading decision should not depend on a single chart line.
Compare the price reaction with trading volume. Changes in volume help describe market activity around the level.

Higher volatility expands price ranges and can produce sharper moves through marked areas, so the market regime matters.
Use liquidity densities as a separate context layer. Large limit orders and support or resistance levels are related concepts, but they are not the same thing.

Open the relevant market and inspect the current price structure.
See where key areas are located relative to price and how the market interacted with them before.

Check volume, volatility, liquidity densities and signals before forming a potential entry or exit scenario.
A level is useful only when the scenario also has a clear condition that makes the idea invalid.
It is a Screener workflow for reviewing key horizontal levels and zones on a chart together with other market data.
No. A level marks an area of previous market reaction, but future price can break through it or react differently.
A level describes a price area on the chart, while a liquidity density is a visible large limit order in the order book. They should be analyzed separately and then compared.
A level can be part of a trading scenario, but a potential entry should also consider price structure, volume, volatility and risk.
Screener supports analysis of Binance and Bybit markets including Spot and Futures; interpretation depends on the specific market context.
No. A breakout alone does not guarantee continuation. The reaction after the break and other context still matter.
Open Screener, choose a trading pair and evaluate support and resistance together with chart structure, volume, volatility and market context.